


A request counter can become an expensive inventory of individual customers when somebody adds user_id to its labels. The application still serves requests, the dashboard still displays a number, and the telemetry pipeline quietly creates a new series for each new customer. Discovering this through an invoice gives the team an expensive feedback loop.
A July r/Observability discussion asked where teams check metric cardinality: instrumentation, CI, the Collector, or the backend. The useful answer spans those boundaries. Define an intentional measurement schema in application code, exercise it with adversarial inputs before deployment, apply carefully chosen runtime controls, and measure what the backend actually stores.
This guide includes a local Node fixture that counts the same 1,000 synthetic requests in two ways. One produces 1,000 series; the other produces six while preserving the request total. Those numbers describe a deterministic teaching example, not a production benchmark or a forecast of a vendor invoice. Your bill can depend on ingestion, active series, retention, query activity, infrastructure, and contract terms. Measure the quantities your actual service charges for.
Download the complete runnable examples, including setup instructions and verification commands.
Understand what creates a series
A metric name alone does not describe its storage footprint. A distinct combination of label values creates a distinct series. A counter with method, route, and status dimensions has many possible identities even before a monitoring system adds target or resource identity. Prometheus specifically advises against labels such as user IDs or email addresses in its metric naming guidance.
Start with the domains of the dimensions. Two methods, four route templates, and three status classes permit up to twenty-four application label combinations. That product is an upper bound for those labels; some combinations may never occur. Multiple instances, environments, and metric families expand the actual inventory. Classic histogram buckets also introduce additional series, including bucket, sum, and count representations, as described in the Prometheus metric types documentation.
Separate the number of series active now from the number created over a retention window. Short-lived containers or frequently changing release labels can generate churn even when each individual process exposes a modest set. A dashboard showing current process count cannot prove that the retained series population is stable. Review both the steady inventory and the rate at which identities appear.
This is also a measurement-design problem. Each dimension should support a concrete operational decision. Route and status class can identify a failing endpoint. A unique request identifier can find one execution, but usually belongs in appropriately protected logs or traces. Hashing an identifier keeps its number of possible values essentially unchanged; it is not a cardinality reduction strategy. Sampling requests may reduce event volume while leaving the set of possible metric identities unbounded.
Normalize at the instrumentation boundary
Record the matched route template, such as /orders/:id, rather than the requested path /orders/98432. Query strings are particularly unsuitable because they can contain arbitrary user input and sensitive values. Unknown routes need a bounded fallback such as /unmatched; copying the unknown path into a label recreates the original problem exactly where a scanner can exploit it.
Use the application's router metadata in a real service. The companion example uses a small explicit matcher to make its behavior testable without installing a framework. Its output has fixed domains: three methods including OTHER, four routes including /unmatched, and three status classes. Grouping statuses loses distinctions, so decide whether exact status codes would be more useful for your incidents. Both choices can remain bounded.
export function boundedLabels(event) {
  return {
    method: ['GET', 'POST'].includes(event.method) ? event.method : 'OTHER',
    route: routeTemplate(event.path),
    status_class:
      event.status >= 200 && event.status < 300 ? '2xx' :
      event.status >= 500 && event.status < 600 ? '5xx' : 'other'
  };
}
Keep the vocabulary stable across teams. If one service exports a route name and another exports a raw path under the same label, a shared dashboard can conceal the difference until traffic changes. Write down allowed labels, their domains or normalization rules, units, and the intended counting boundary. Count a completed request once, and document how aborted requests are treated. Prometheus's instrumentation guidance connects label choices and counter behavior to the resource cost and usefulness of instrumentation.
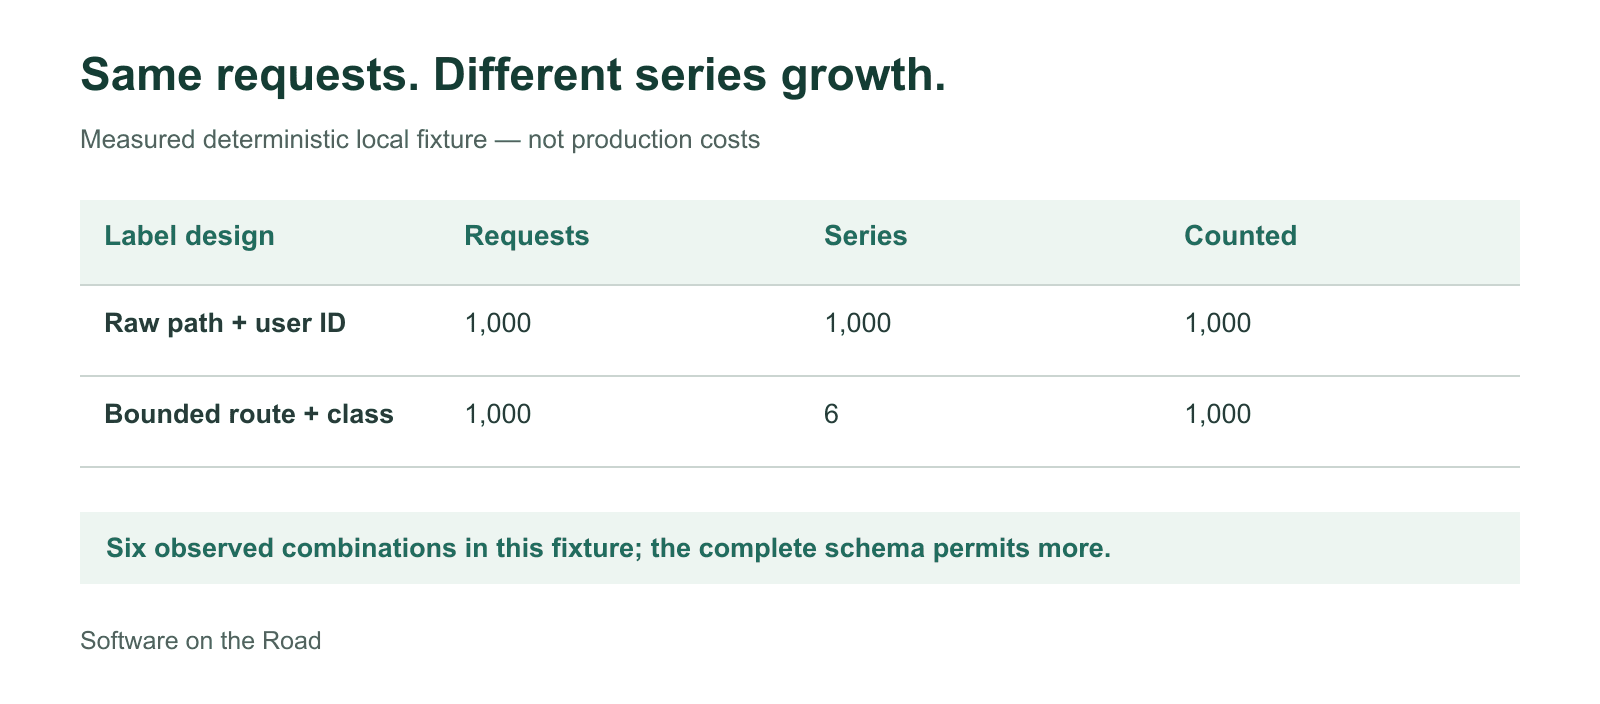
These are measured local fixture results. They illustrate series growth, not a production cost comparison.
Make the budget executable in CI
The companion directory contains a dependency-free counter model, a deterministic workload, and tests. Run it with Node 22 or newer:
cd examples
node --test cardinality.test.mjs
node demo.mjs --max-series=12
node demo.mjs --legacy --max-series=12
The last command intentionally exits with status one. The bounded workload creates six series; adding raw paths and unique synthetic user IDs exceeds the twelve-series fixture budget. Twelve is a regression threshold for this particular workload, not a recommended production cardinality limit. The complete bounded schema permits more combinations than this fixture happens to exercise.
Assert more than a small series count. The tests verify that all 1,000 requests remain counted, unknown paths use a single fallback, query strings do not enter the route value, and changing object property order does not create a new identity. Another test verifies that a label-removal operation rejects colliding identities. These assertions catch an implementation that appears cheap only because it drops observations or serializes labels inconsistently.
For your service, generate requests with many different identifiers, arbitrary unknown paths, unusual methods, and representative failure responses. Record the exact metric names and dimensions that result. Maintain an allowlist of meaningful schema changes alongside the instrumentation code. A review can then ask why a new dimension is necessary and what it does to the budget before the change reaches production.
Do not place the fixture's throwing budget guard directly in a production request handler. It deliberately fails a test process when a new series exceeds the budget. A real SDK's documented overflow or error behavior must keep instrumentation failures from breaking user requests. Test the production integration against your pinned client version, including what happens when a limit is reached.
The local model is intentionally small. It does not implement an OpenTelemetry SDK, a Prometheus server, concurrent collection, or histogram aggregation. Its passing tests establish the fixture's normalization and counting behavior. They do not establish compatibility with a particular exporter or vendor backend.
Use SDK controls before observations fan out
Runtime protection should start close to the source. OpenTelemetry Views can select dimensions for a metric stream; attribute filtering occurs before the SDK's cardinality limit is applied. The OpenTelemetry metrics SDK specification also defines a cardinality limit and an overflow attribute set. When supported, overflow accounting preserves measurements while giving up their original dimensional detail.
Check your language SDK and pinned package version before copying a configuration example. A specification describes required and recommended behavior; an installed library determines the constructor options and features you can actually use. The JavaScript instrumentation documentation is the appropriate starting point for the integration in a Node service. This lab does not install or execute that SDK.
Decide what an overflow means operationally. If an incident pushes observations into a shared overflow stream, a total request count may remain useful while a route-specific error ratio becomes less representative. Test your alert queries under that condition. Monitor overflow behavior through the signals your implementation provides and give somebody ownership of investigating it. A protective limit should expose a schema problem instead of silently making a dashboard less trustworthy.
An SDK limit is a ceiling, not a substitute for normalization. A service that regularly reaches the ceiling still has unstable measurement design. First remove dimensions that do not answer an operational question; then use a supported limit as protection against regressions and unusual input.
Be careful when a Collector removes labels
A Collector provides a shared place to inspect and transform telemetry. That makes it useful for enforcing policy and reducing exported payloads, but it does not make every attribute deletion a correct metric aggregation. The Collector transformation documentation describes processor-based transformations and their performance considerations. Treat each pipeline change as application behavior that needs a representative payload test.
Consider two cumulative counter streams from one producer at the same collection time:
const rows = [
  { labels: { route: '/orders/:id', user_id: 'a' }, value: 11 },
  { labels: { route: '/orders/:id', user_id: 'b' }, value: 7 }
];
projectUniqueSeries(rows, ['route']);
// Throws: label removal creates a duplicate metric identity
Deleting user_id maps both rows onto the same identity. Merely forwarding those rows does not calculate a coherent new stream. The example refuses to guess because the correct operation depends on the metric type, temporality, timestamps, and stream ownership. Histograms need compatible bucket representations; gauges do not automatically have a meaningful sum.
The Collector contrib metricstransform processor documents an explicit aggregate_labels operation. It also states a crucial boundary: its aggregation is limited to metrics within a batch. It does not aggregate across batches or multiple nodes and clients. Read that boundary in the processor documentation before treating it as a service-wide reduction mechanism. No Collector configuration was executed in this lab, so a production change still needs a test using your exact distribution and version.
Independent application instances introduce another trap. Removing their identifying attributes can make their cumulative counters overlap. One instance may restart while another continues counting. A naive sum of their cumulative samples can then confuse reset handling. The OpenTelemetry metrics data model explains stream identity, temporality, and the single-writer principle that underlie these concerns. Preserve the information required to interpret a stream until a component deliberately performs the appropriate aggregation.
For Prometheus queries, a common pattern is to calculate rates for individual counter series before summing them:
sum by (route) (
  rate(app_http_requests_total[5m])
)
Prometheus's function documentation explains why applying rate before aggregation preserves reset detection. This example assumes the underlying series retain the target identity needed to distinguish counters. A query cannot recover identities that an earlier transformation already destroyed. Validate the complete path from instrumentation to dashboard.
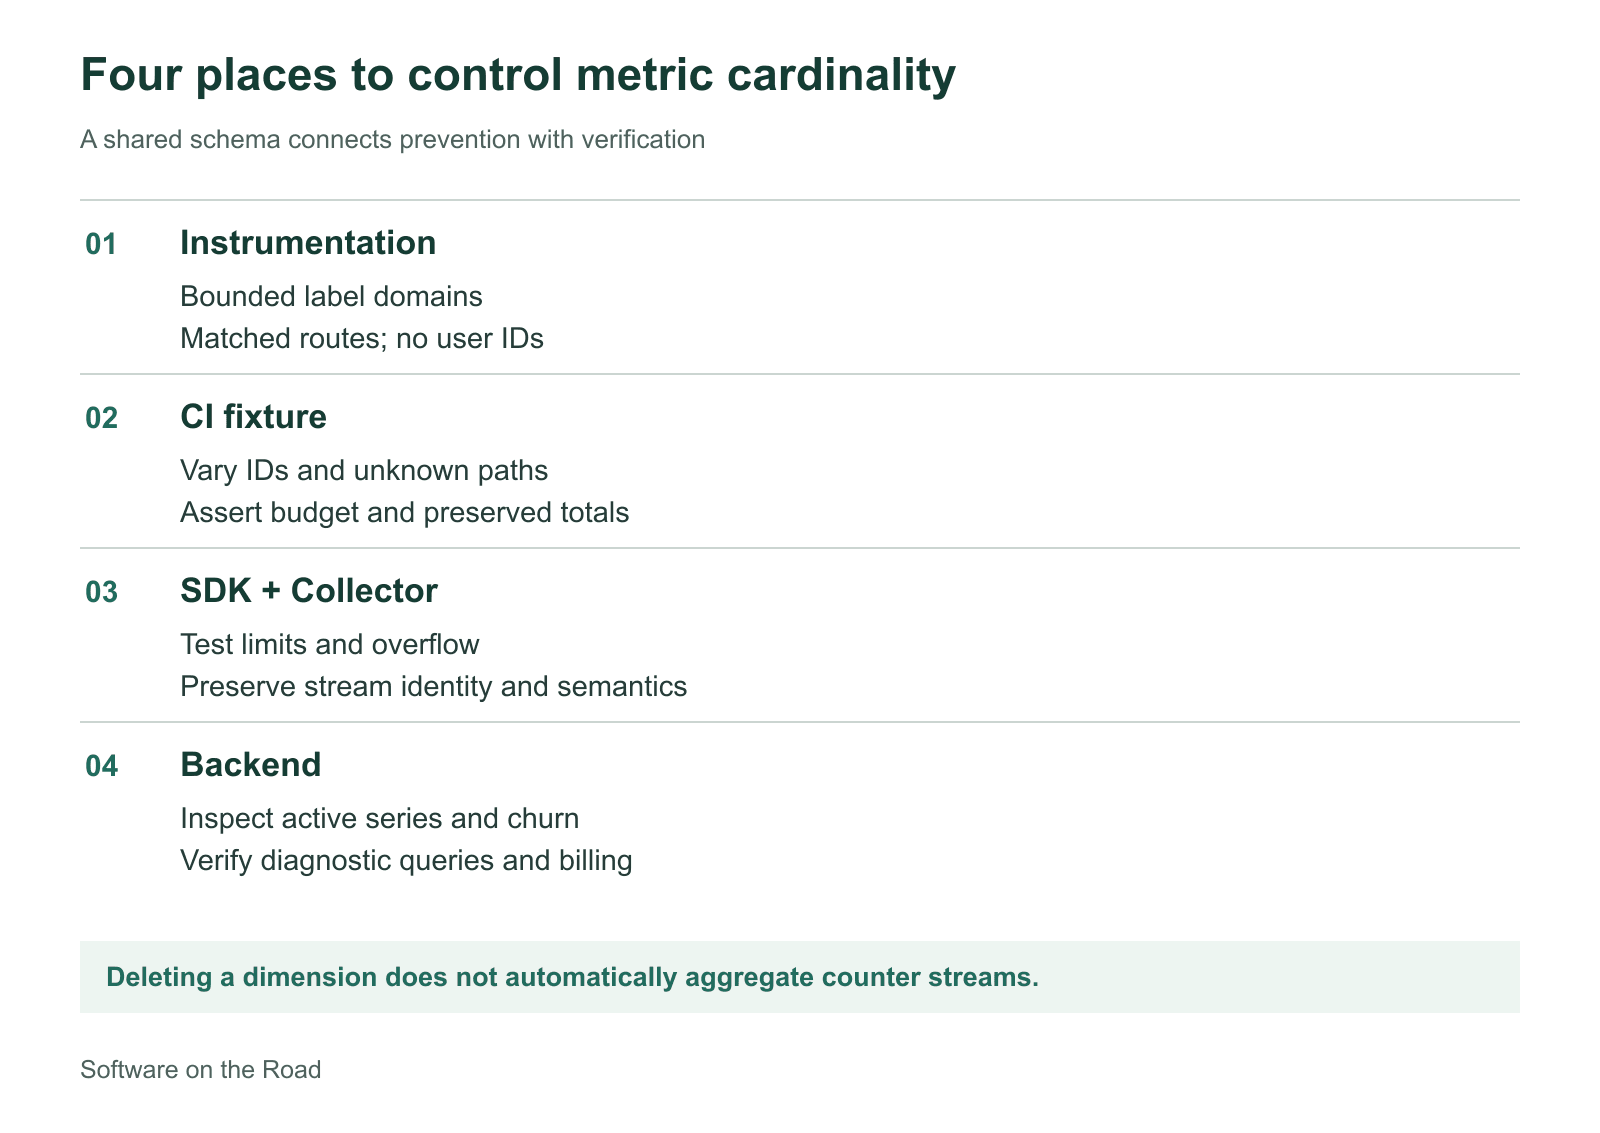
Each boundary answers a different question: intended schema, generated series, transformation semantics, and stored inventory.
Verify the inventory the backend receives
After deployment, inspect the backend rather than assuming the source-side improvement propagated correctly. Automatic instrumentation, exporters, infrastructure agents, and resource enrichment may contribute dimensions outside the application counter you changed. Compare the service's measurements before and after the rollout over comparable traffic and instance counts.
For a Prometheus server you control, its HTTP API exposes TSDB information, including head series totals and leading metrics, labels, and label pairs. A read-only request can begin an investigation:
curl --fail --silent --show-error \
  'http://localhost:9090/api/v1/status/tsdb?limit=10'
Run that against an authorized endpoint with the authentication and network protection your deployment requires. The lab has no running Prometheus server, so this command is a documented integration example. TSDB status describes that server's view; a remote backend may ingest or retain a different population. Use the remote service's own inventory and billing reports as well.
Compare series counts by metric and by service, then investigate the dimensions responsible for unexpected growth. A single global total may look healthy while one team's new histogram expands rapidly. Track newly created identities, active inventory, exported sample volume, and ingestion failures where those measurements are available. Avoid placing arbitrary offending label values into another metric while trying to diagnose the first one.
Cost attribution requires a separate check. If your provider bills for samples, lowering scrape frequency can affect charges differently from reducing active series. If retention or query resources dominate the cost, a label change may primarily improve query behavior. Attach the relevant billing unit and observation period to any savings claim. The local six-versus-one-thousand result supports a cardinality lesson only.
Roll out with a diagnostic acceptance test
Before removing a dimension, write the investigation that depends on it. Can the on-call engineer still find the failing route, separate server errors from expected client responses, and identify a problematic deployment? If the answer depends on a user identifier, design the connection to a suitable trace or log search instead of quietly removing the capability. Apply the access controls and data handling rules appropriate to those signals.
Canary the new schema on a small, identifiable subset of instances. Compare request totals and error rates against a stable independent source over the same window. Account for counter resets, collection intervals, late arrivals, and the fact that old series may remain visible until they age out. Use a new metric name when a changed meaning would make historical comparisons misleading, and plan the dashboard migration explicitly.
Keep an easy reversal for accidental telemetry loss, but avoid reintroducing unrestricted identifiers merely to restore an old chart. A corrected schema and a carefully scoped temporary investigation can often recover useful evidence with less disruption. Record the reason for each retained dimension so the next engineer does not add an expensive one to solve a question that another signal already answers.
The durable outcome is a small feedback loop with a named owner. Code defines the measurement, CI proves how it grows under varied inputs, runtime controls make failures visible, and backend inspection confirms the inventory and financial effect. Revisit that loop when routes, dependencies, SDKs, exporters, or deployment patterns change. Cardinality stays manageable when a metric's diagnostic purpose and its growth behavior remain visible together.


